What engineers see
- Decision readiness under shipping pressure
- Cognitive load and flow quality over time
- Supervisory AI load and trust calibration
- Verification burden and review hotspots
- Recovery margin and sustained capacity

AI Engineering Teams
In AI-assisted engineering, the risk is often not low output. The risk is high output with rising verification burden, fragmented flow, and invisible supervisory load.
Pair VS Code, Cursor, or Claude Code and Ascenda reads how hard the loop is working — call volume, retry storms, context compaction, budget pressure, loop depth, and how long a stretch ran without a break.

Every AI-assisted hour splits into creating, verifying, and supervising: directing the tools, correcting their output, checking what ships.
The supervisory share grows quietly, concentrates on senior engineers, and rarely retreats on its own. Ascenda tracks it week by week, per cohort, so the shift from building to babysitting is visible while it is still cheap to reverse.
Share of engineering time spent directing, correcting, and verifying AI output · illustrative data
From the AI Workload report in the Ascenda dashboard: directing, correcting, and verifying load across twelve weeks. See all five reports →
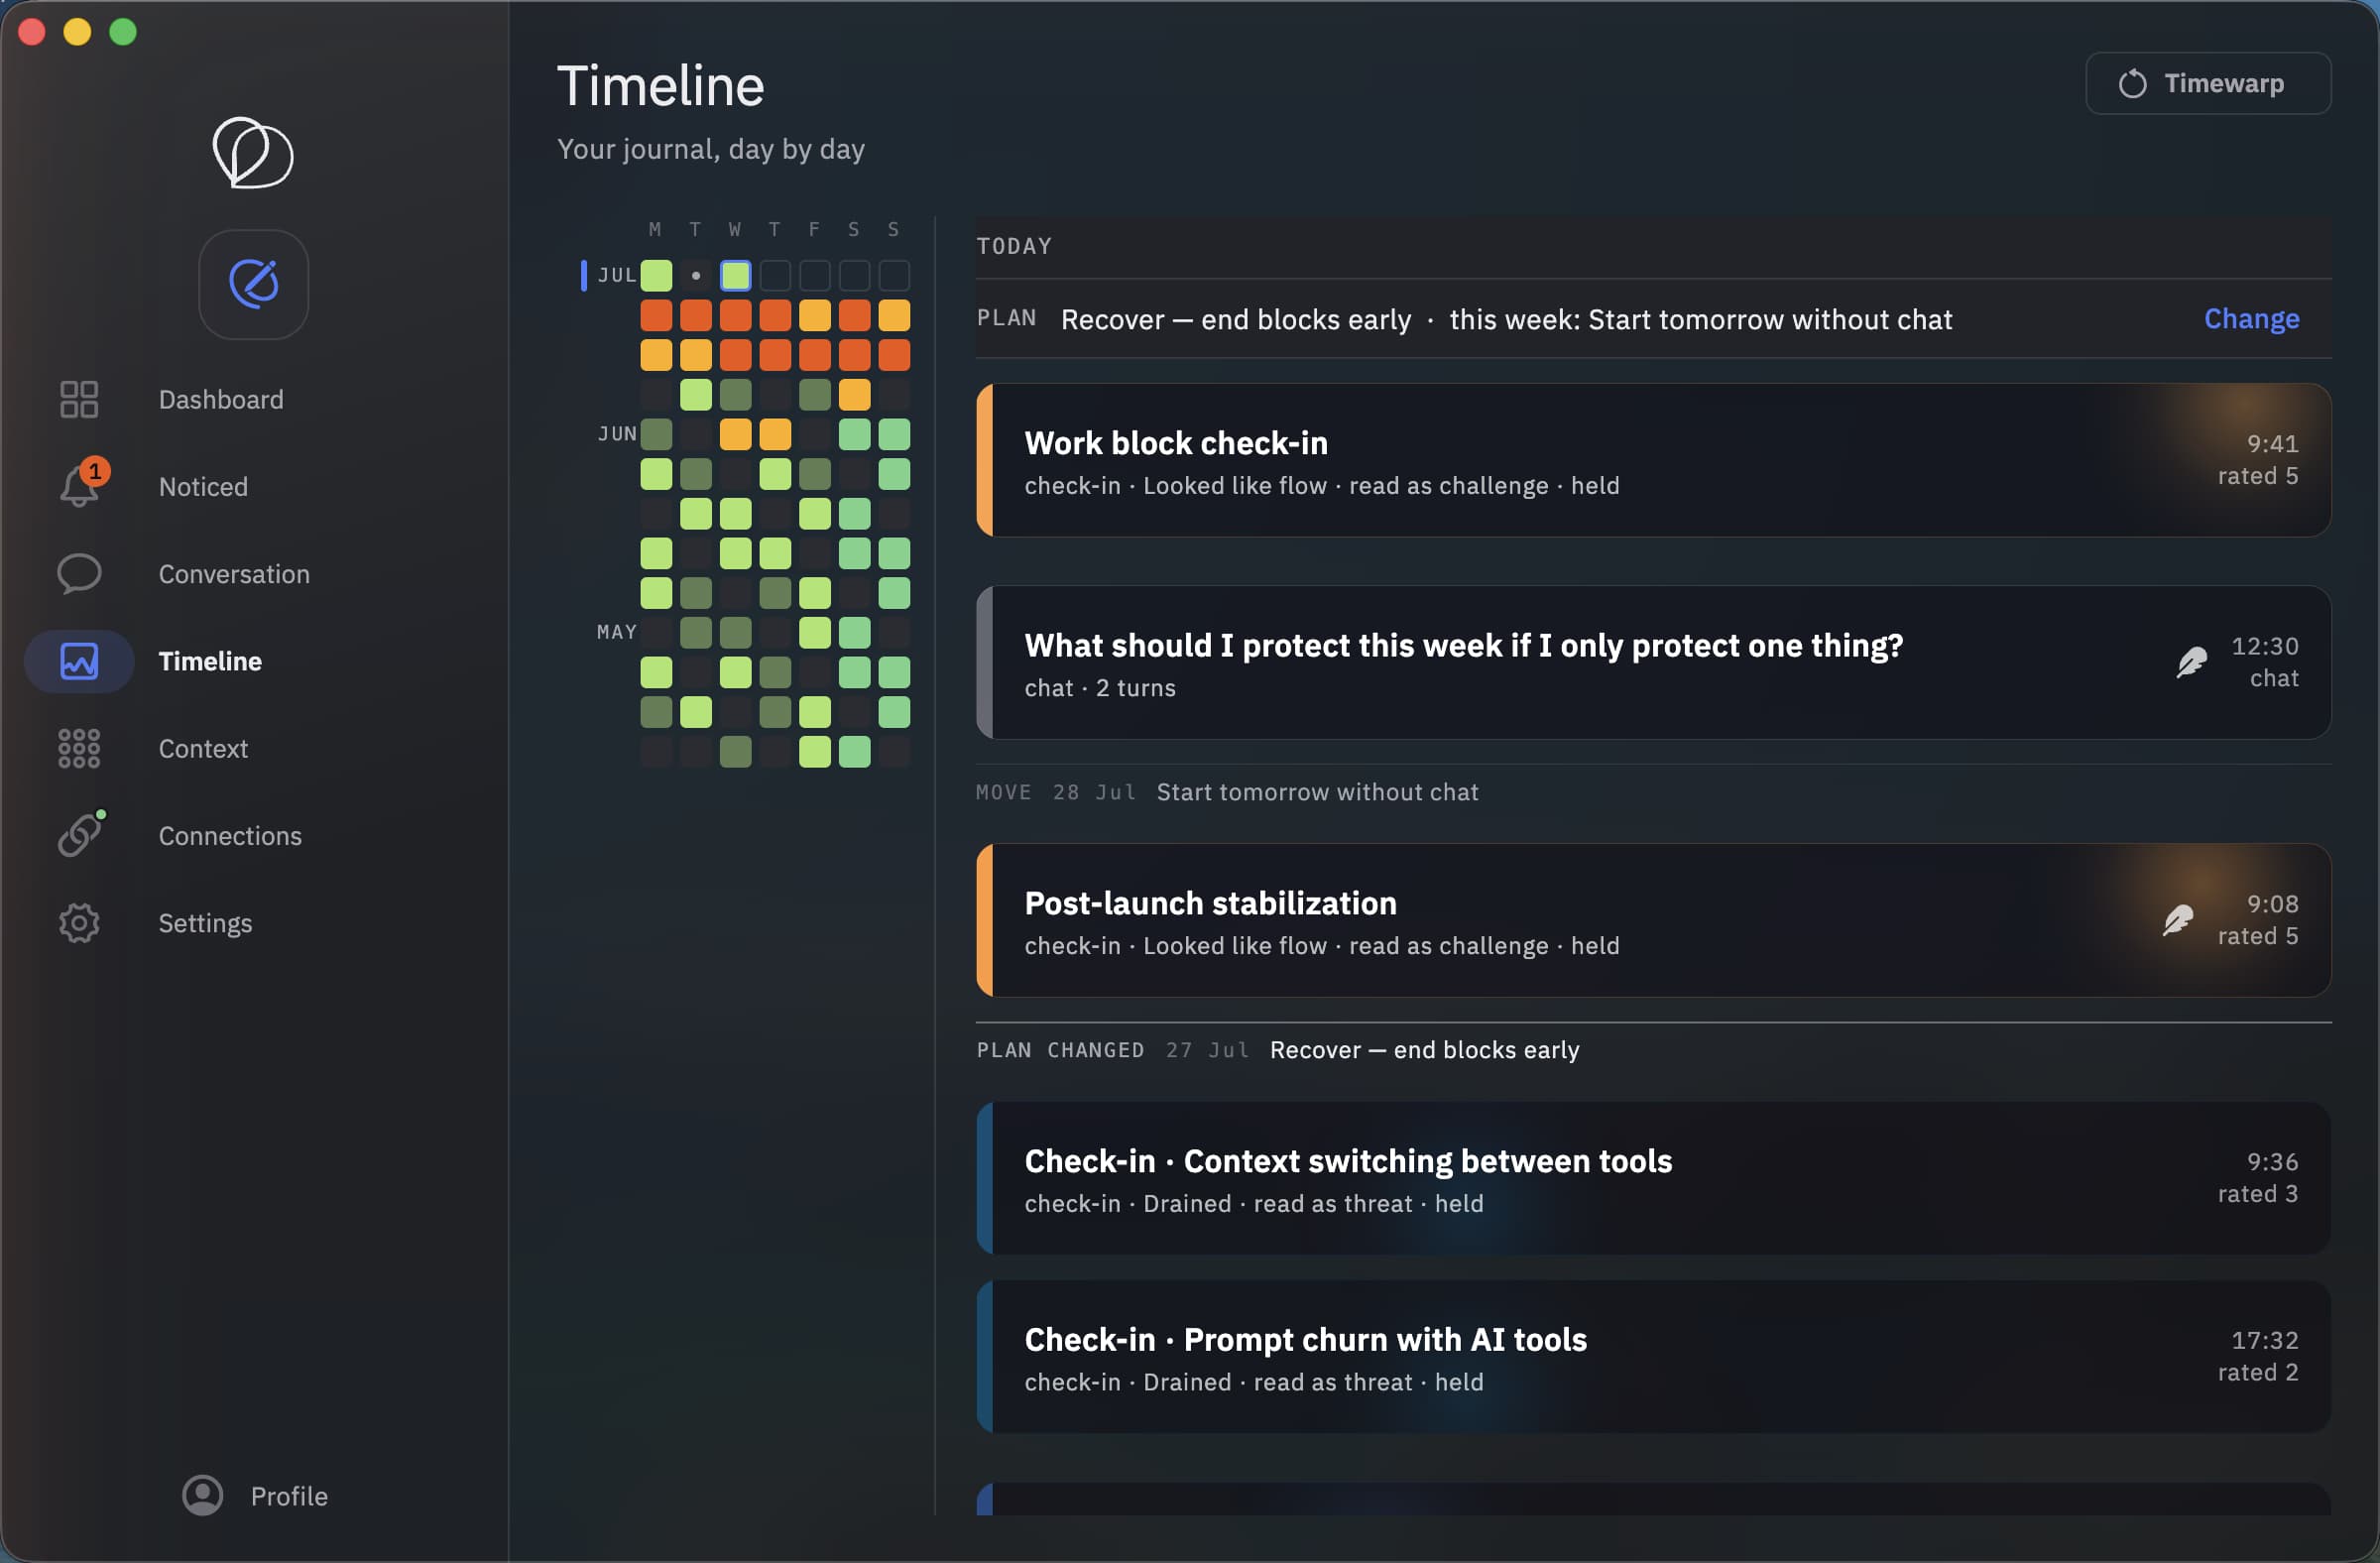
Each check-in takes a few seconds and lands in a journal the engineer owns. Where the strain has a name — prompt churn, context switching between tools — it is because they wrote it down, not because a model guessed.
That record is what makes the patterns readable later, and it is also what makes them arguable. Nothing here is a verdict.
12-week trend across cognitive balance, flow state, and feedback loops · illustrative data
From the DevEx Health report: cognitive balance, flow state, and feedback loops tracked per cohort. How the report reads these →
Cognitive balance, flow state, and feedback loops, tracked weekly for every cohort. A flow score sinking below the mid-fifties usually means chronic interruption.
Slow erosion across all three dimensions is what hidden strain looks like in engineering teams: delivery holds steady while the experience of doing the work degrades.
Engineering delivery can look healthy while lived experience declines. Ascenda helps teams monitor sustainability, not just throughput.
Explore the productivity-experience gap research →Next step